Gnome Data Mine: Bin Chart
Bin Chart
[download]Bin Chart can be downloaded from here and saved into a file which should be made executable (chmod u+x binchart) and then run the script (./binchart --help).
Bin Chart is a shell script using gnuplot and transfig to generate a binned, frequency, bar chart of the single column of data supplied. The output is PDF, EPS, FIG, or PNG graphics. FIG output means that xfig can be used to fine tune the chart or to add extra annotations and then exported from xfig to PDF or EPS or PNG.
Bin Charts are created from just a single data file. The title can be changed (--title) and even turned off by supplying an empty string as the argument to the option. The graphics output format is chosen with --type. See the --help option for details.
A sample input file might be:
  157.6
  122.1
  198.4
  191.7
  1830.0
  ...
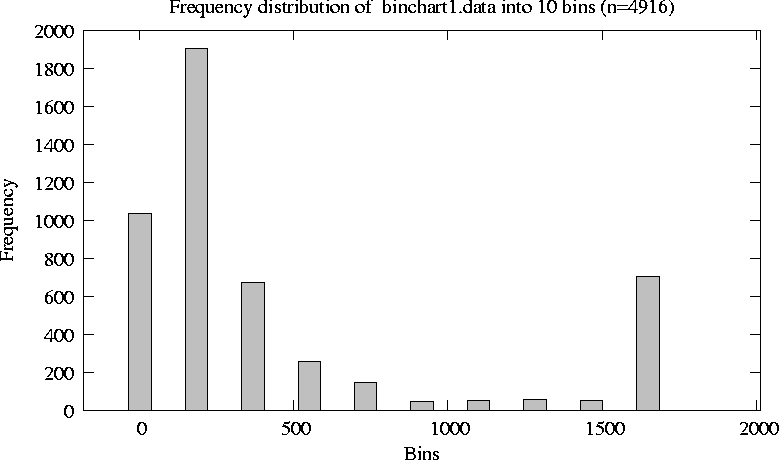
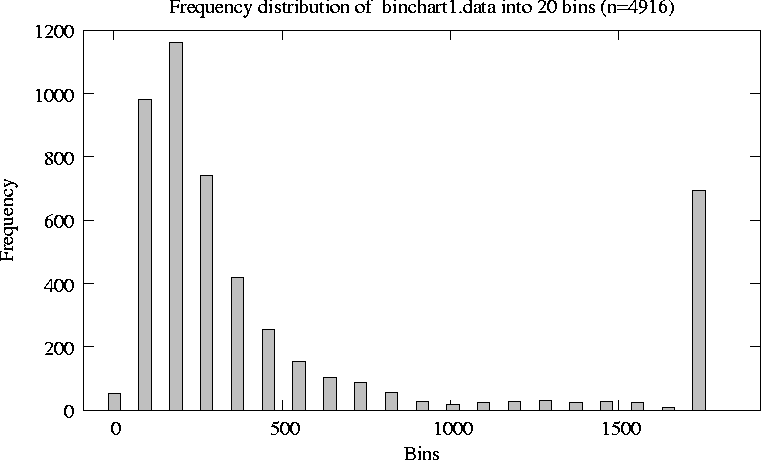
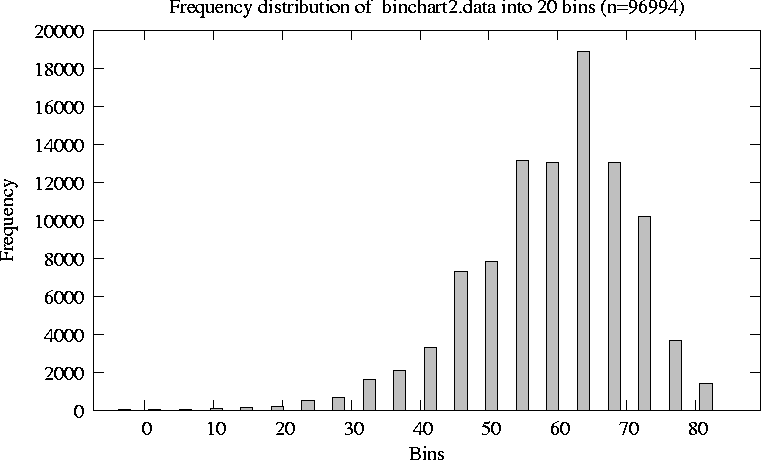
Below is a seleciton of bin charts produced with Bin Chart. The two data files used are binchart1.data and binchart2.data. The command used to produce the PNG file is given. Note that the output resolution is not as good as a vector graphic file (e.g., PDF, EPS, or FIG).
$ binchart -T png binchart1.data > binchart1.png
$ binchart -T png binchart1.data > binchart1a.png
$ binchart -T png binchart2.data > binchart2.png
Copyright © 2006 Graham.Williams@togaware.com
Last modified: Tue Jan 3 16:13:33 EST 2006