Desktop Survival Guide
by Graham Williams
|
|
DATA MINING
Desktop Survival Guide by Graham Williams |
|
|||
Dates and Times |


|
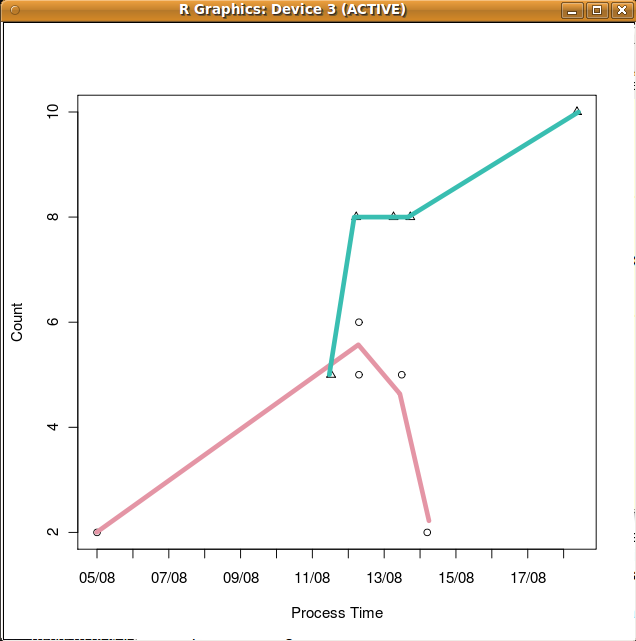
As we have seen, R has full support for dealing with dates and times. The following example uses traditional graphics to illustrates some the basic functionality for visualising dates. The result can be seen in Figure 32.1.
> library(colorspace)
> obs <- c("2004-08-05 09:08:48", "2004-08-13 20:53:38",
           "2004-08-14 13:57:23", "2004-08-12 16:17:41",
           "2004-08-12 16:15:27", "2004-08-11 21:38:24",
           "2004-08-12 14:28:41", "2004-08-18 18:04:47",
           "2004-08-13 15:23:14", "2004-08-14 02:36:33")
> obs <- as.POSIXct(obs)
> set.seed(123)
> x <- data.frame(date=obs,
                  fruit=rep(c("Apple","Watermelon"), each=5),
                  count=round(c(runif(5, 0, 6), runif(5, 5, 11))))
> x11()
> plot(x$date, x$count, xlab="Process Time", ylab="Count", xaxt='n',
       pch=c(rep(c(1,2), each=5)))
> axis.POSIXct(1, at=seq(min(x$date), max(x$date), "days"), format="%d/%m")
> fruit.class <- table(x$fruit)
> fcolor <- rainbow_hcl(length(fruit.class))
> for(j in 1:length(fruit.class))
  {
      fruit <- names(fruit.class)[j]
      lines(smooth.spline(x[x$fruit==fruit, "date"],
                          x[x$fruit==fruit, "count"]),
            col=fcolor[j], cex = 0.5, lwd=5)
  }
> screenShot("rplot_simple_dates", title="RPlot", close=TRUE)
|
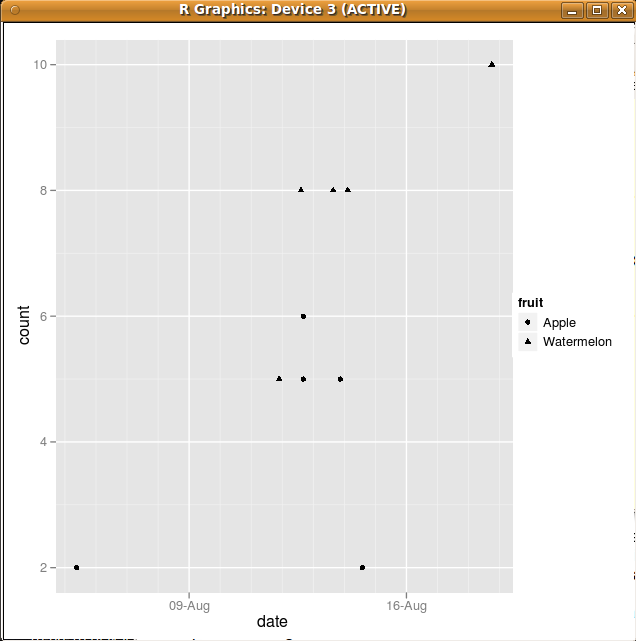
Using the same data we can start to get a ggplot2
version
of the plot as can be seen in Figure ![[*]](crossref.png) .
.
> library(ggplot2) > pl <- qplot(date, count, data=x, shape=fruit) |