Desktop Survival Guide
by Graham Williams
|
|
DATA MINING
Desktop Survival Guide by Graham Williams |
|
|||
Scoring |


|
Building a model and exploring the structure of the model (tree, rules, formula) will provide many new insights and new knowledge. However, we often want to apply a model to a dataset to generate the scores (i.e., probabilities) for each observation in the dataset. Such scores may be useful for further exploration in other tools, or for actual deployment of the model.
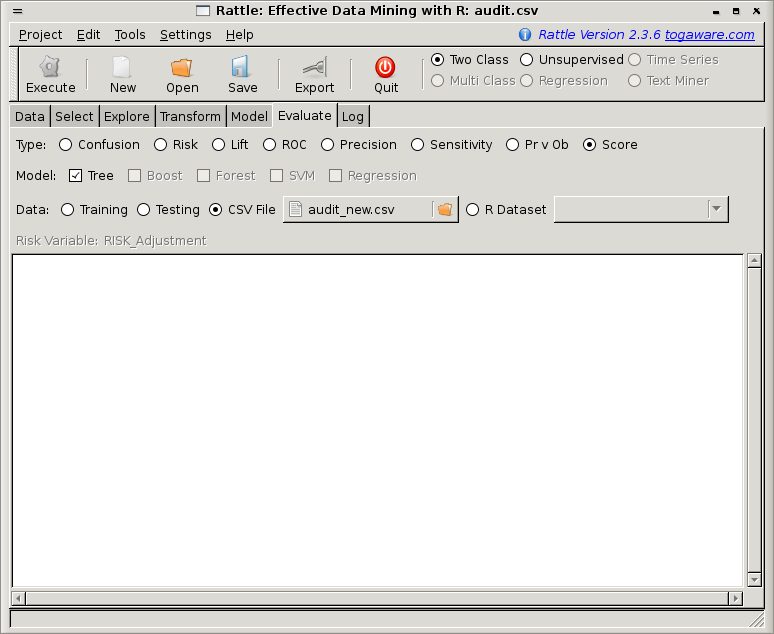
Rattle's Score option of the Evaluate tab, when Executed, will apply the selected model(s) to the specified dataset (Training/Testing/CSV File/R Dataset) saving the results into a CSV file. Figure 22.3 shows the situation with the Score radio button activated, a Tree model selected, and a CSV file identified.
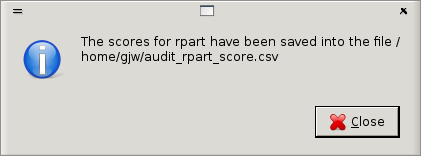
Once executed, the scores, together with any ID variables, will be
saved into a CSV file for actioning or for further processing with
other tools, as desired. A window will popup to indicate the location
and name of the file into which the scores have been saved
(Figure 22.4). The filename in
this case is audit_rpart_score.csv. The name itself is
generated from the name of the dataset (audit), appended with
the type of model (rpart, which is the decision tree tool
used), and the literal _score, with a .csv
extension. The file will be saved into the current working folder. The
Status bar will also indicate that the scores have been saved.
Rattle can readily score the Testing dataset, the Training dataset, a dataset loaded from a CSV data file, or a dataset already loaded into R. For evaluation purposes, scoring the training dataset is not recommended. An evaluation based on the same data on which the model was built will provide an optimistic estimate of the model's performance. Rattle will popup a window to warn us when we score the training dataset.
The dataset that is scored must have exactly the same schema as the dataset loaded for training/testing. Rattle assumes the columns will be in the same order and we might expect them to have the same names (noting that R is case sensitive).
A simple test example is to use the sample audit dataset (i.e., click
on the Execute button whilst in the Data tab without any CSV Filename
chosen), build a Tree model (click Execute whilst in the Model tab),
and choose to score the Testing dataset. The resulting CSV file
(called audit_test_rpart_score.csv in this case) will be saved,
and viewing it in a text editor will show that it begins with:
"ID","predict" 1047095,0.208029197080292 1047698,0.735449735449735 1062363,0.0615183246073298 1085176,0.0615183246073298 1094029,0.208029197080292 1110947,0.0615183246073298 1133761,0.0615183246073298 ... |
Each line of the generated score file (CSV format) will consist of a comma separated list of all of the variables that have been identified as IDs in the Variables tab. This is followed by the score itself which will be a number between 0 and 1, indicating the probability that the observation should be classified into the ``1'' class, assuming the default Two Class paradigm.
Exercise:
audit_test_rpart_score.csv.
We can load the scores dataset into many other applications. Being in CSV format facilitates this. In business, for deployment, the data may be loaded into the corporate datawarehouse and linked to actual client data so that those clients with a high risk score might automatically be migrated into a case management system for review by the organisation's case officers.
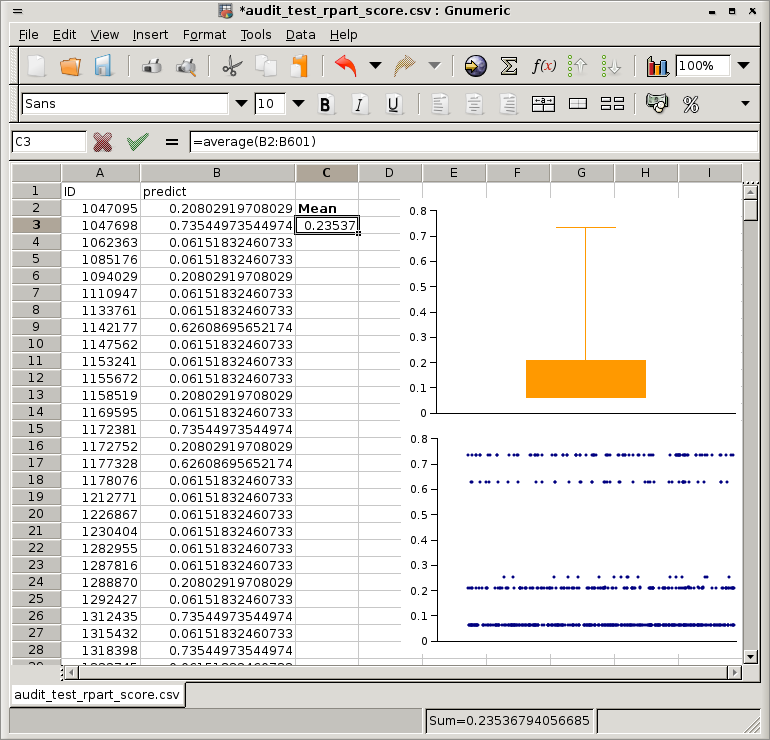
Alternatively, the data may be further analysed for other business intelligence type tasks. We might load the file into a spreadsheet (like the open source Gnumeric spreadsheet). Users in general might be more familiar with manipulating data in a spreadsheet, or through using the corporate business intelligence tool. This is facilitated and encouraged by the powerful open source philosophy of multiple tools working together to help with complex tasks.
Figure 22.5 illustrates a typical analysis, where we use a box plot to show the distribution of the scores and a XY plot to give a different view of the distribution, ordered simply by the ID. We can see that most of the cases have received a low score (0.06) but there is a spread of ``higher risk'' entities.
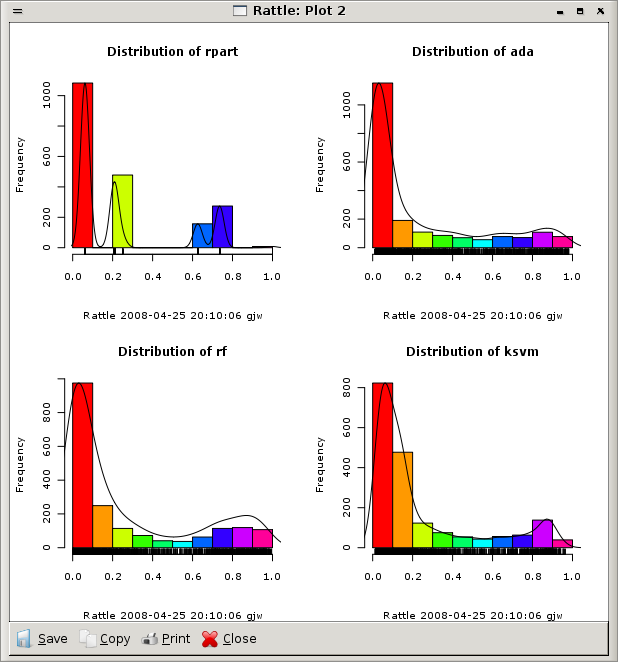
Of course, we might also load the resulting score file (which is a CSV
file) back into Rattle and this will then allow us to explore the
distribution of the
scores. Figure ![[*]](crossref.png) illustrates
this for four models. This immediately shows us how the simpler
decision tree model only generates a very small number of distinct
score values, whilst the more sophisticated modellers give more of a
spread of scores.
illustrates
this for four models. This immediately shows us how the simpler
decision tree model only generates a very small number of distinct
score values, whilst the more sophisticated modellers give more of a
spread of scores.
Todo: section on Calibration Curves