Desktop Survival Guide
by Graham Williams
|
|
DATA MINING
Desktop Survival Guide by Graham Williams |
|
|||
Building a Model |


|
Todo: Get a two dimensional dataset, like Hastie, and build models over that.
Let's have a look at the simplest of problems. Suppose we want to model one variable (e.g., a person's height) in terms of another variable (e.g., a person's age).
We can create a collection of people's ages and heights, using some
totally random data:
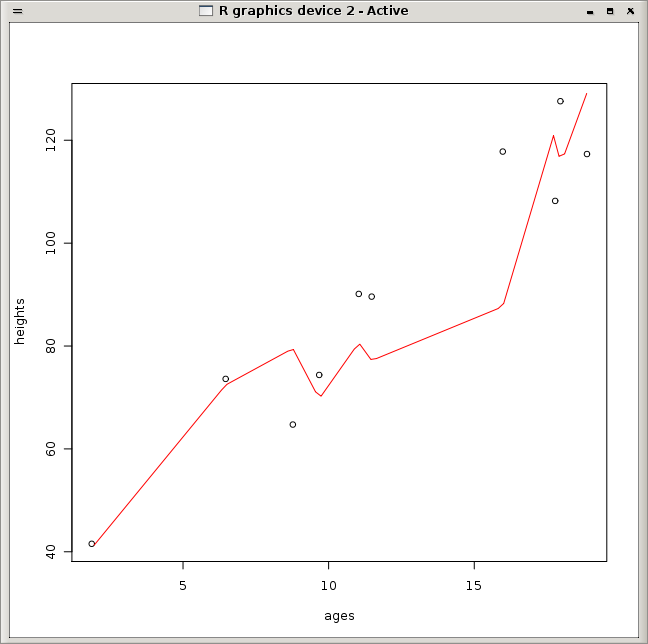
> set.seed(123) # To ensure repeatability. > ages <- runif(10, 1, 20) # Random ages between 1 and 20 > heights <- 30 + rnorm(10, 1, as.integer(ages)) + ages*5 > plot(ages, heights) |
> my.model <- approxfun(ages, heights) > my.model(15) [1] 85.38172 > plot(my.model, add=TRUE, col=2, ylim=c(20,200), xlim=c(1,20)) |
The resulting plot is show in Figure 25.1. We can see it is only an approximate model and indeed, not a very good model. The data is pretty deficient, and we also know that generally height does not decrease for any age group in this range. It illustrates the modelling task though.
Todo: Convert this to R code to generate better quality plot.
> my.spline <- splinefun(ages, heights) |