Desktop Survival Guide
by Graham Williams
|
|
DATA MINING
Desktop Survival Guide by Graham Williams |
|
|||
Memory Usage |


|
On MS/Windows you may need to set the memory size for use by R using the command-line flag -max-mem-size. The amount of memory currently in use and allocated to the R process is given by the memory.size function (only available on MS/Windows).
The example below indicates that some 470MB is in use, altogether about 1GB has been allocated.
> memory.size() # Current memory in use: 470MB |
[1] 477706008 |
> memory.size(TRUE) # Current memory allocated: 1GB |
[1] 1050681344 |
The memory limit currently in force in R is reported by the memory.limit function (also MS/Windows specific) which can be used to set the limit.
> memory.limit() # Current memory limit: 1GB |
[1] 1073741824 |
> memory.limit(2073741824) # New memory limit: 2GB |
NULL |
> memory.limit() |
[1] 2684354560 |
A suggested process is to work with a subset of all the data loaded in memory, using a dataset small enough to make this viable. Explore the data, explore for the choice of models, and prototype the final analysis using this smaller dataset. For the final full analyses one may need to allow R to run overnight with enough RAM.
A data frame of 150,000 rows and some 55 columns will be about 500MB of RAM.
Also, note the difference between data frames and arrays/matrices. For example, rbind'ing data frames is much more expensive than rbind'ing arrays/matrices. An array/matrix must have all data of the same data type in each column while data frames can have different data types in different columns. A number of functions are written to handle either data frames or matrices (e.g., rpart) and it is best, if possible, to use a matrix in these cases. The coercion back to a data frame can always be done afterwards.
Be aware that to convert a data frame to a matrix we can use the as.matrix function:
> m <- as.matrix(dframe) |
However, if there are any character columns, all the data is converted to character.
To obtain an estimate of the amount of memory being used by an object in R use the object.size function:
> object.size(ds) # Object ds is using 181MB |
[1] 181694428 |
The following function can be used to explore memory requirements:
> sizes <- function(rows, cols=1)
    {
      testListLength <- 1000
      cellSize <- object.size(seq(0.5, testListLength/2, 0.5))/testListLength
      cells <- rows * cols
      required <- cells * cellSize
      if (required > 1e12)
        result <- sprintf("%dTB", required %/% 1e12)
      else if (required > 1e9)
        result <- sprintf("%dGB", required %/% 1e9)
      else if (required > 1e6)
        result <- sprintf("%dMB", required %/% 1e6)
      else if (required > 1e3)
        result <- sprintf("%dKB", required %/% 1e3)
      else
        result <- sprintf("%dBytes", required)
      return(result)
    }
|
For example, on a 32bit machine, a 1 million row dataset with 400 columns might require about 3GB of memory:
> sizes(1000000, 400) |
[1] "3GB" |
Heuristic Andrew's blog, posted 4 January 2010, adds an example of plotting the memory usage of objects.
First we create some example variables:
> k1 <- 1:1000 > k2 <- 1:10000 > k3 <- 1:100000 |
Now print the aggregate memory usage statistics (only needed on MS/Windows - otherwise Inf for infinity is printed):
> print(paste('R is using', memory.size(), 'MB out of a limit of', memory.limit(), 'MB'))
|
[1] "R is using Inf MB out of a limit of Inf MB" |
We can create a function to calculate the memory consumption of a collection of objects:
> object.sizes <- function(obs=ls(envir=.GlobalEnv))
  {
    return(rev(sort(sapply(obs,
                           function (object.name)
                           object.size(get(object.name))))))
  }
> object.sizes(c("k1", "k2", "k3"))
|
    k3     k2     k1
400040  40040   4040
|
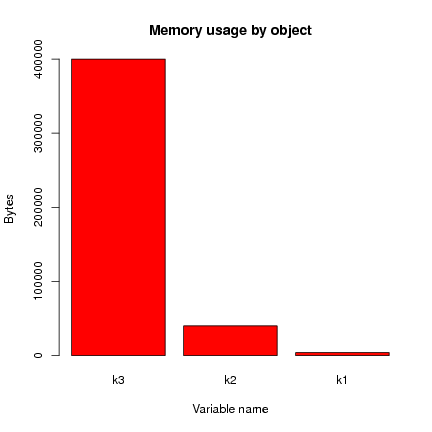
This is usefully presented as a bar plot:
> barplot(object.sizes(c("k1", "k2", "k3")),
  	main="Memory usage by object", ylab="Bytes", xlab="Variable name",
  	col=heat.colors(length(object.sizes())))
|
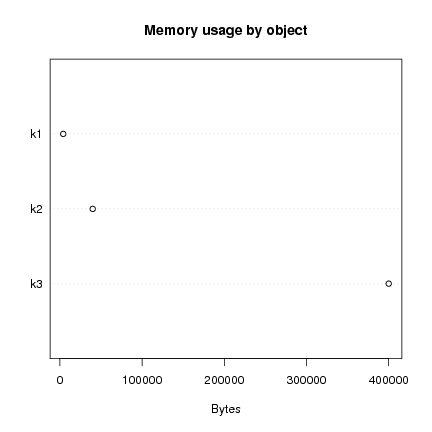
Some prefer the dot chart:
> dotchart(object.sizes(c("k1", "k2", "k3")),
           main="Memory usage by object", xlab="Bytes")
|
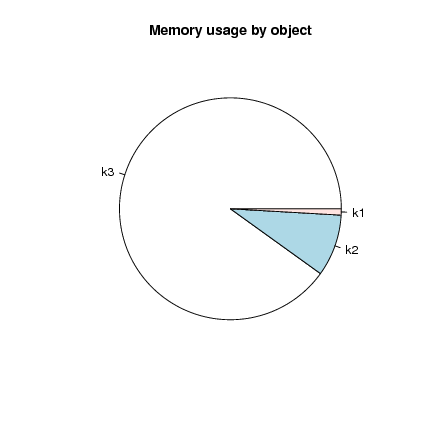
And it's always good to avoid the pie chart (difficult to compare angular segments) but in this case it is not too bad:
> pie(object.sizes(c("k1", "k2", "k3")), main="Memory usage by object")
|