
Desktop Survival Guide
by Graham Williams
|
|
DATA MINING
Desktop Survival Guide by Graham Williams |
|
|||
Boxplot by Class |


|
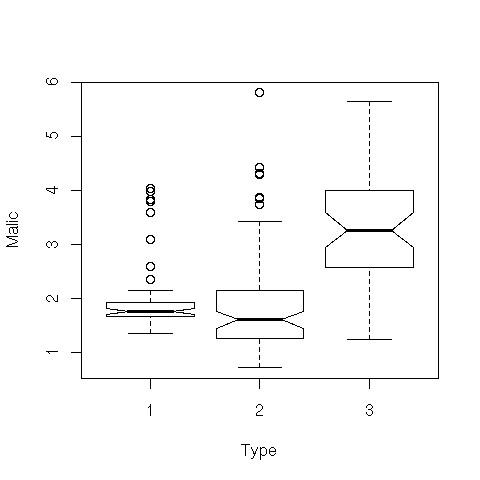
With a boxplot it is often useful to display the
distribution of one variable as it relates to some other variable. An
example in the wine data would be to partition the data according to
the Type, and then to explore the resulting distribution of,
for example, Malic. This is achieved with the formula
notation Malic ~ Type. The boxplot then allows us to
understand any potential relationship between the input variable and
the output variable. For such plots we enable the notch display, which
indicates whether there is a significant difference between the
medians. In the case here the median for Type 3 is
significantly different from the other two, but the other two are not
significantly different from each other.
load("wine.Rdata")
attach(wine)
boxplot(Malic ~ Type, notch=TRUE, xlab="Type", ylab="Malic")
|