
Desktop Survival Guide
by Graham Williams
|
|
DATA MINING
Desktop Survival Guide by Graham Williams |
|
|||
Tuning a Boxplot |


|
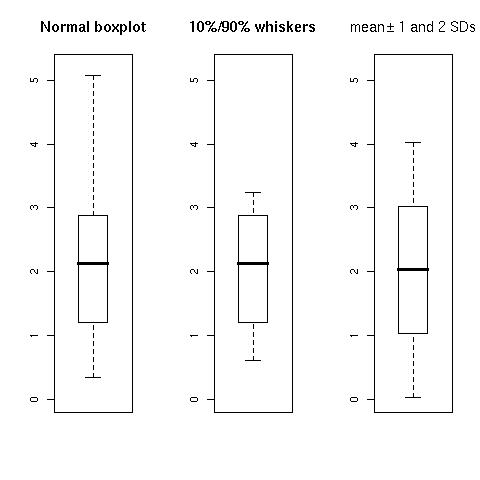
Here we illustrate how we can refine exactly what we want to draw in the box plot. Three boxplots are produced on the single plot using par to set Roption[]mfrow to one row and three columns. We then collect the output from the boxplot function which we might look at to determine inforamtion about what is being plotted. In this case we might decide to set the limits of the boxplot to be 0 and 5.2, and we note the other statistics in the stats attribute of the output.
> boxplot.info
$stats
      [,1]
[1,] 0.340
[2,] 1.200
[3,] 2.135
[4,] 2.880
[5,] 5.080

$n
[1] 178

$conf
         [,1]
[1,] 1.936044
[2,] 2.333956

$out
numeric(0)

$group
numeric(0)

$names
[1] "1"
|
The bxp function (used internally by boxplot) is used to plot the boxplot.
We now modify the boxplot information (the stats attribute) to use 10% and 90% deciles (obtained using quantile) instead of the default 0% and 100% deciles.
> deciles 0% 10% 20% 30% 40% 50% 60% 70% 80% 90% 100% 0.340 0.607 0.872 1.324 1.738 2.135 2.460 2.689 2.980 3.233 5.080 |
This generates the second boxplot.
Finally, a completely different boxplot showing the mean +/- one and two standard deviations, is produced. The structure used by bxp for recording the information to be plotted is built from scratch, in particular the 5 stats used to specify where the limits go.
oldpar <- par(mfrow=c(1,3))

x <- wine$Flavanoids
boxplot.info <- boxplot(x, plot=FALSE)
bxp(boxplot.info, main="Normal boxplot", ylim=c(0,5.2))

deciles <- quantile(x, probs=seq(0,1,0.1))
boxplot.info$stats[1] <- deciles["10%"]
boxplot.info$stats[5] <- deciles["90%"]
bxp(boxplot.info, main="10%/90% whiskers", ylim=c(0,5.2))

boxplot.limits <- as.matrix(c(mean(x) - 2*sd(x),
                            mean(x) - sd(x),
                            mean(x),
                            mean(x) + sd(x),
                            mean(x) + 2*sd(x)))
boxplot.meansd <- list(stats = boxplot.limits,
                       n = length(x),
                       conf = NULL,
                       out = numeric(0))
bxp(boxplot.meansd, main=expression("mean" %+-% "1 and 2 SDs"), ylim=c(0,5.2))

par(oldpar)
|