Togaware DATA MINING
Desktop Survival Guide
by Graham Williams
Google

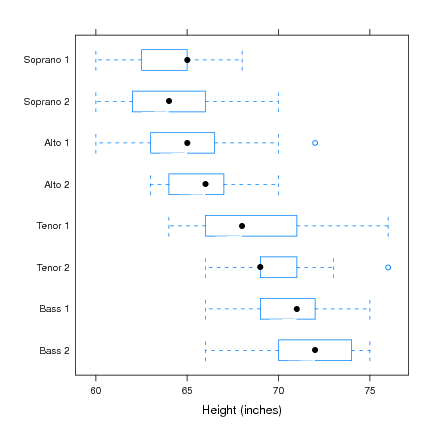
Boxplot Using Lattice


> library(lattice)
> x <- bwplot(voice.part ~ height, data=singer, xlab="Height (inches)")
> print(x)

Image dmsurvivor-runderstand:boxplot_lattice


Copyright © Togaware Pty Ltd
Support further development through the purchase of the PDF version of the book.
The PDF version is a formatted comprehensive draft book (with over 800 pages).
Brought to you by Togaware. This page generated: Sunday, 22 August 2010