
Desktop Survival Guide
by Graham Williams
|
|
DATA MINING
Desktop Survival Guide by Graham Williams |
|
|||
GGobi: Interactive Data Exploration |


|
GGobi is a powerful, free and open source tool for visualising data, supporting brushing and tours. It is integrated with R through the rggobi package which provides the ggobi function, and is an excellent adjunct to the basic visualisations provided by Rattle. Its key uses in a data mining context include multivariate outlier detection,
To use the GGobi option of the Explore tab the GGobi application will need to be installed on your system. GGobi runs under GNU/Linux, OS/X, and MS/Windows and is available for download from http://www.ggobi.org/.
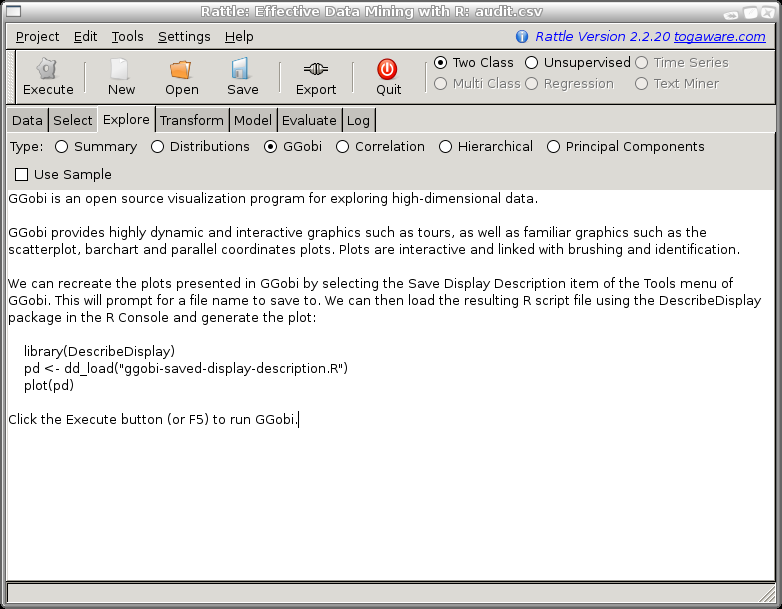
GGobi is very powerful indeed, and here we only cover some basic functionality. With GGobi we are able to explore high-dimensional data through highly dynamic and interactive graphics such as tours, scatterplots, barcharts and parallel coordinates plots. The plots are interactive and linked with brushing and identification.
The available functionality is extensive, but includes being able to review entities with low or high values on particular variables and to view values for other variables through brushing in linked plots. Panning and zooming is supported. Data can be rotated in 3D, and we can tour high dimensional data through 1D, 2D, and 2x1D projections, with manual and automatic control of projection pursuits.
Once we have invoked GGobi from R we can interact with the plots and through R programmatically. This allows, for example, clusters identified in Rattle to be displayed and explored in the GGobi plots. Within GGobi plots we might also highlight points and then within R identify those points for further analysis.