Desktop Survival Guide
by Graham Williams
|
|
DATA MINING
Desktop Survival Guide by Graham Williams |
|
|||
Mosaic Plot |


|
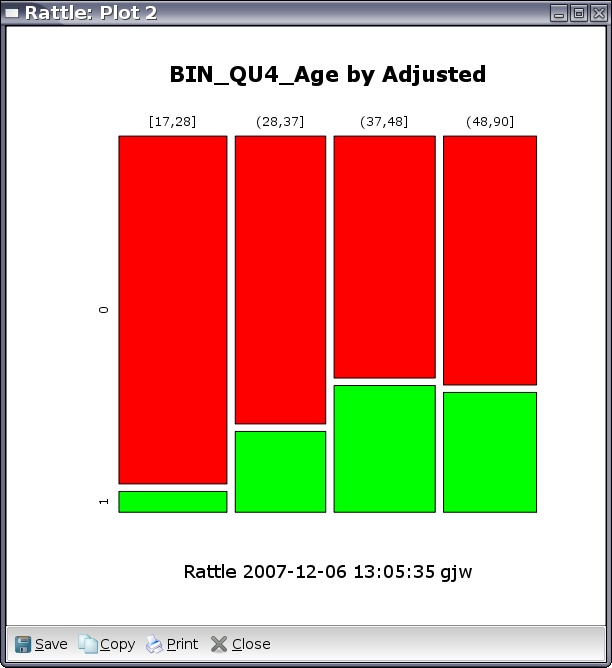
A mosaic plot is an effective way to visualise the distribution of the values of a variable over the different values of another variable. Often, this second variable is the target variable that we are interested in (e.g., Adjusted in our audit).
The example in Figure 6.3 displays the relationship between the input variable Age and target variable Adjusted. Age is a numeric variable, so for it to make sense in a mosaic plot we need to bin it so that it becomes categoric, which can be accomplished using the Remap option of the Transform tab. In this case we have transformed Age into 6 quantiles (equal sized groups).
The plot tells us that XXXX