
Desktop Survival Guide
by Graham Williams
|
|
DATA MINING
Desktop Survival Guide by Graham Williams |
|
|||
Interactive Visualisations |


|
R is an excellent tool for producing plots, particularly where we wish to then present these plots within other documents, and require the best quality. That, is, we generate static plots based on our exploration by issuing commands to R through the R Console, or through Rattle. There is little opportunity in R to interact with a plot once it has been displayed.
Being able to easily interact with a plot can add significantly to the efficiency of our data exploration and lead to the discovery of interesting and important patterns and relationships. A data miner exhibits a sophisticated skill in dynamically interacting with the visualisations of data to provide insights. The software supports this, but the true insights come from the skill of the data miner. We must take time to explore our data, to identify relationships and insights.
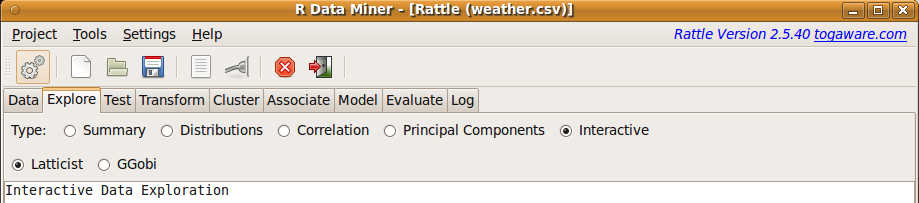
Rattle provides access to two very powerful R packages for interactive data analysis: latticist and rggobi. These can be accessed through the Interactive option of the Explore tab (Figure 7.1). We introduce each here. Do note that each application has much more functionality than can be covered here, and indeed, rggobi has its own book (, ).
 |