Desktop Survival Guide
by Graham Williams
|
|
DATA MINING
Desktop Survival Guide by Graham Williams |
|
|||
Latticist |


|
The latticist package provides a graphical and interactive interface to the advanced plotting capabilities of R's lattice package (, ). It is written in R itself and allows the underlying R commands that generate the plots to be directly edited and their effect immediately viewed.
We initiate latticist within Rattle from the Interactive option of the Explore tab. With the Latticist radio button selected, click the toolbar's Execute button to display latticist's window, as in Figure 7.2.
 |
From the R Console we can use the latticist function to display the same interactive window for exploring the weather dataset:
> latticist(weather) |
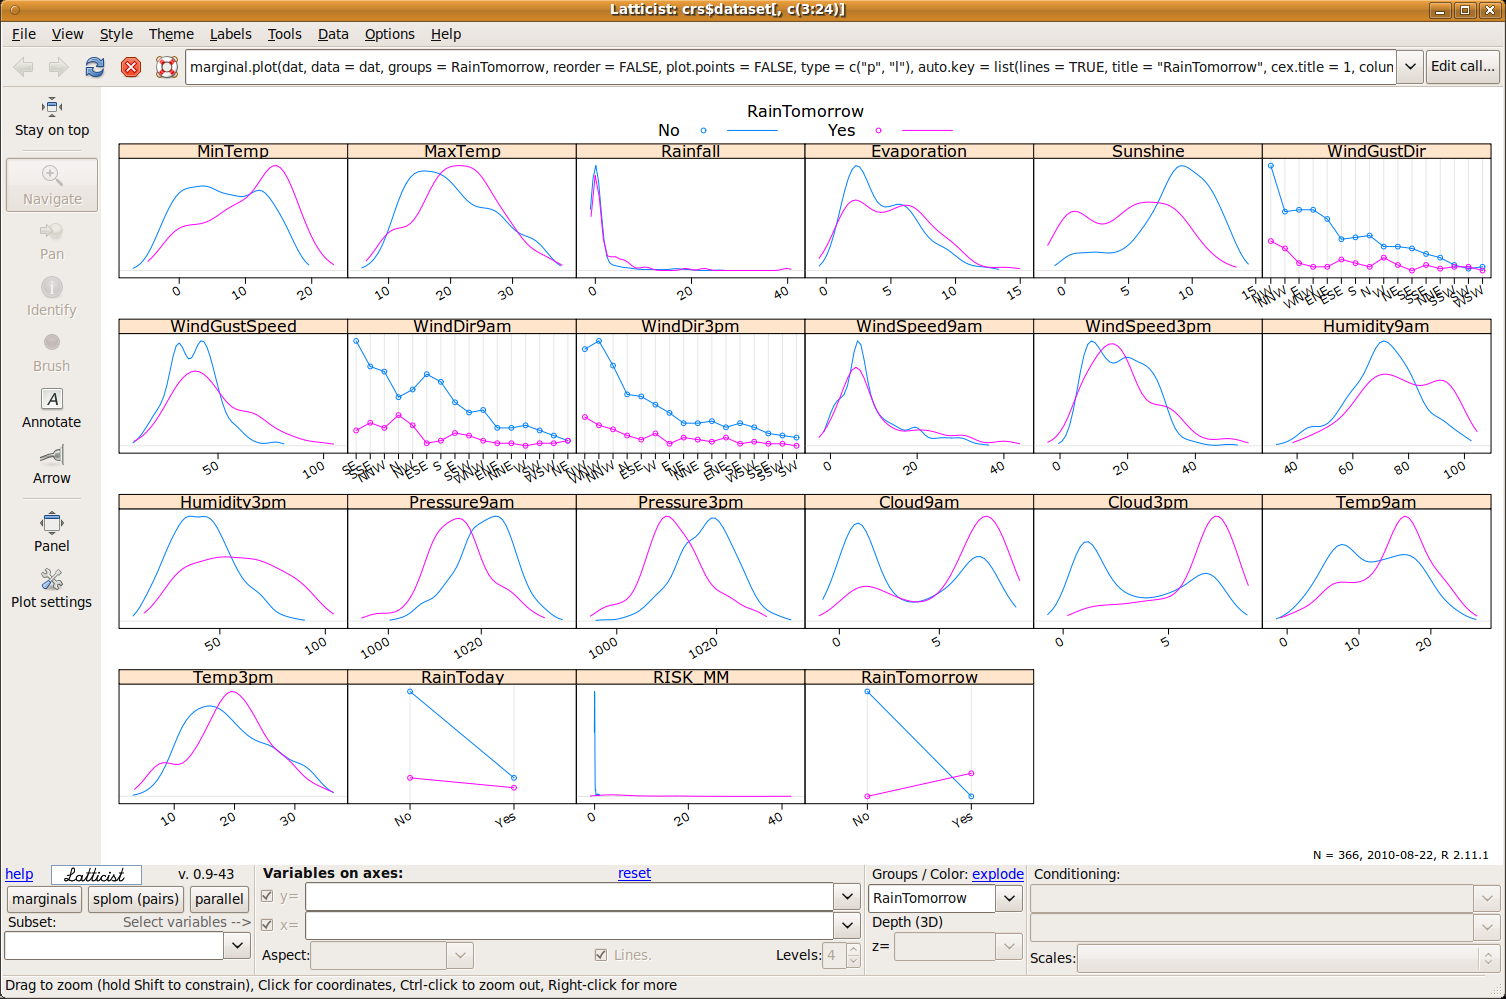
We can immediately begin to obtain an overall view of the story our data might be telling us. Note that by default the plots have grouped the data by the target variable RainTomorrow. Also note that numeric data is illustrated with a density plot whilst categoric data is displayed using dot plots.
Many of the plots show some differences in the distributions for the two groups (with RainTomorrow is No or Yes). We might note, for example, that variables MinTemp and MaxTemp have slightly higher values for the observations where it rains tomorrow. The amount of Rainfall today seems to be almost identically distributed for observations where it does not rain tomorrow and where it does. There seems to be less Sunshine on days prior to days on which it rains.
The latticist package, and it's companion package, playwith, provide quite a set of features for interacting with our visualisations. The actual command used to generate the plot currently displayed is shown at the top of the window. We can modify the command and immediately see the result, either by editing the command in place or clicking the Edit call... button. The latter results in the display of a small text window in which the command can be edited. There are buttons in the main window's toolbar to open the help page for the current plot, to reload the plot, and to navigate to previous plots.
The default plot we see is a plot of the marginal distribution of the
variables. The buttons near the bottom left of the window allows us to
select between marginal, splom (pairs), and a
parallel coordinates plot. A splom is a scatter plot
matrix, similar to that in Section ![[*]](crossref.png) . A parallel
coordinates plot draws a line for each observation from one variable
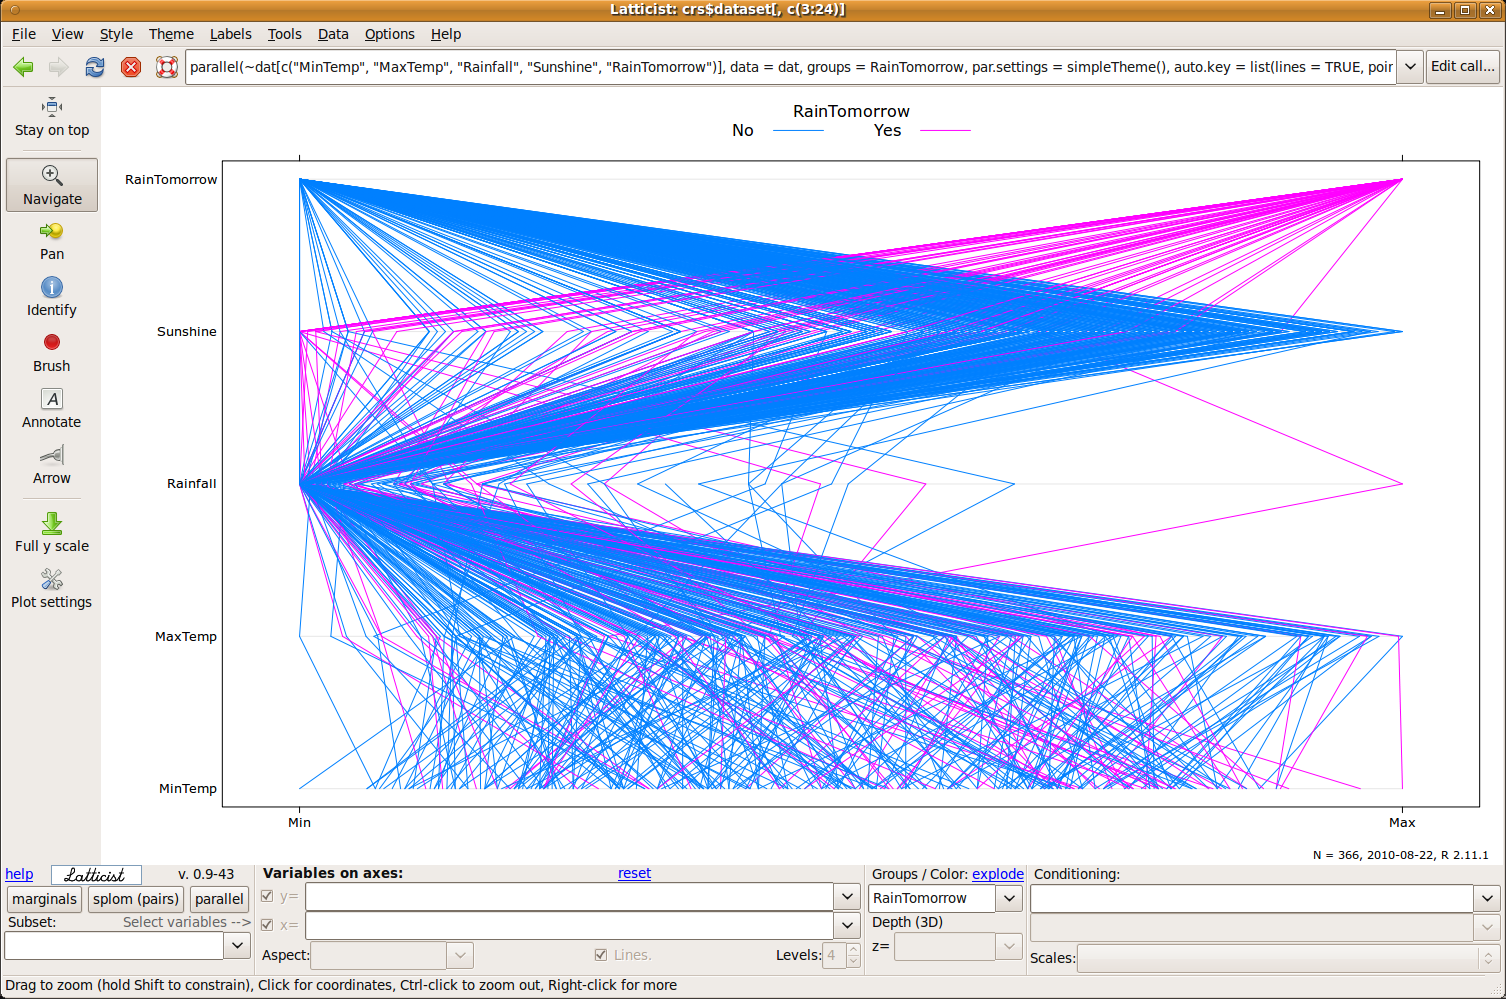
to the next, as in
Figure 7.3.
. A parallel
coordinates plot draws a line for each observation from one variable
to the next, as in
Figure 7.3.
The parallel coordinates plot exposes some structure in the Weather dataset. The top variable, in this case, is the target variable, RainTomorrow. Next is the variable Sunshine, then Rainfall, MaxTemp, and MinTemp.
Noting that each line represents a single observation (the weather details for one day) we might observe that for days when there lesser sunshine it is more likely to rain tomorrow, and similarly when there is more sunshine it is less likely to rain tomorrow. We can observe a strong band of observations with no rain tomorrow, higher amounts of sunshine today, and little or no rainfall today. From there (to the remaining two variables) we might observer very little structure in the data, from this visualisation.
There is a lot more functionality available in latticist and playwith. Exploring many of the different options through the interface is fruitful. We can add arrows and text to plots and then export the plots for inclusion in other documents. The data can be subset and grouped in a variety of ways using the variables available. This can lead to many insights, following our nose, so to speak, in navigating our way through the data. All the time, we are on the lookout for structure, and must remember to capture this to support the story that we find the data telling us.