Desktop Survival Guide
by Graham Williams
|
|
DATA MINING
Desktop Survival Guide by Graham Williams |
|
|||
Scatterplot |


|
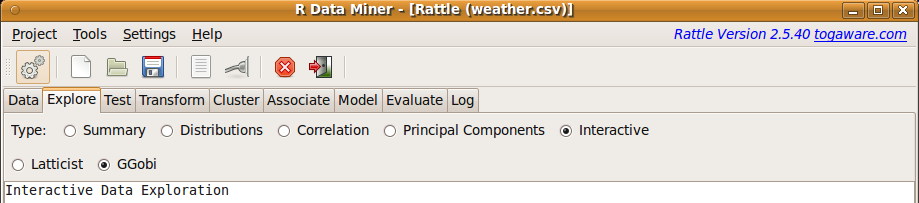
We can start GGobi from Rattle by clicking the Execute button while having selected GGobi under the Interactive option of the Explore tab, as in Figure 7.1.
 |
We can also initiate GGobi with the rggobi function, providing it with a data frame to load:
> gg <- ggobi(weather) |
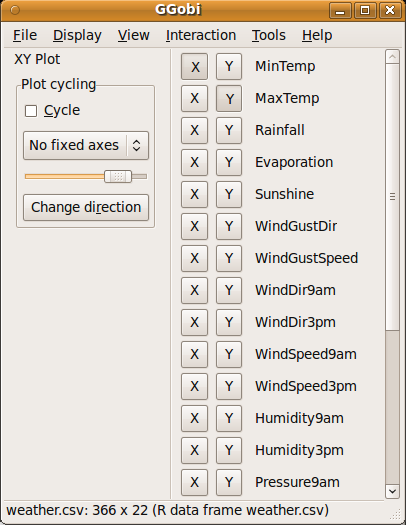
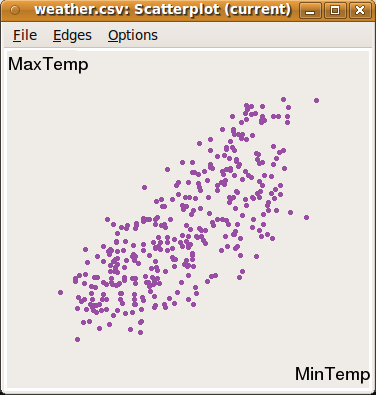
On starting, GGobi will display the two windows shown in Figure 7.5. The first provides controls for the visualisations and the other displays the default visualisation (a two variable scatterplot of the first two variables of the supplied data frame).
The control window provides menus to access all of the functionality of GGobi. Below the menu bar we can see the XY Plot (i.e., scatterplot) options. Two variables are selected from the variable list on the right hand side of the control window. The variables selected for display in the scatterplot are for the x-axis (X) and the y-axis (Y). By default, the first (MinTemp) and second (MaxTemp) are chosen. We can choose any of our variables to be the X or the Y by clicking the appropriate button. This will immediately change what is displayed in the plot.